

Migration is a crucial phase in the annual cycle of wild birds.
In some cases migration is innate, in others it is learned. But it is always a question of successfully joining one area to another, sometimes, often, thousands of kilometres away.
The journey requires remarkable abilities in terms of orientation, reaction to weather conditions, choice and availability of stopover places. The ability to feed efficiently during stopovers in order to replenish the energy reserves used during the first leg so as to be able to cover the next, and so on, is also crucial.
The phenology – the timing – of migration is an essential parameter in successful migration. The bird must leave in time to reach its destination site at the right moment, taking into account the stages to be covered and the food resources available from the beginning to the end of the journey. In the case of insectivorous passerines, these resources are essentially a function of the annual cycle, which in turn depends on the local weather.
Some species/populations consistently adapt their migration timing. Others seem to be “set” on a genetically predetermined schedule.
But what happens when the weather conditions are peculiar, when the climatic situation changes rapidly? To what extent do different bird species react appropriately? And if some do not, to what extent does this influence the evolution of their populations in terms of abundance and distribution?
By studying the migration phenology of different bird species ringed in Belgium during migration, we wish to contribute to this evaluation.
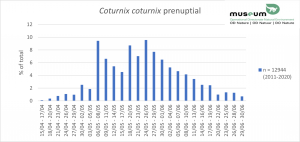
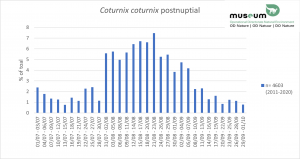
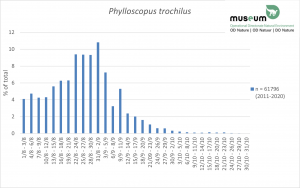
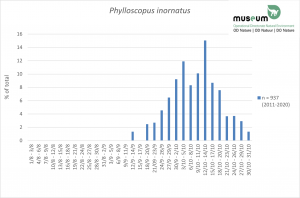
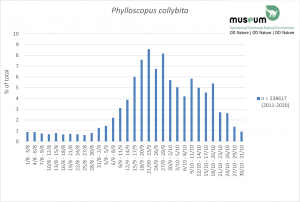
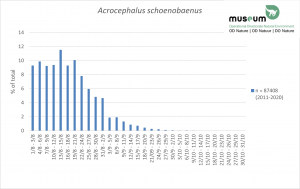
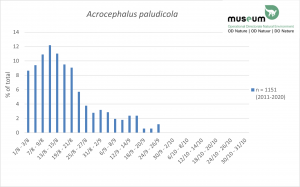
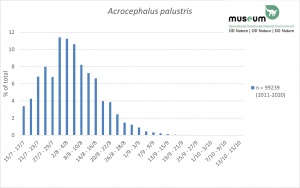
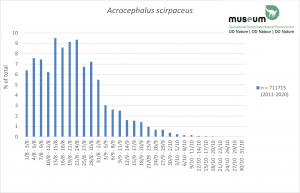
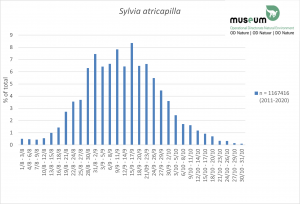
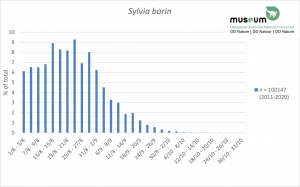
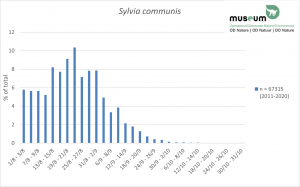
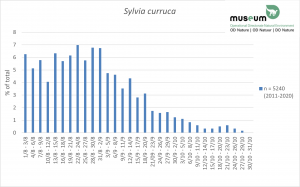
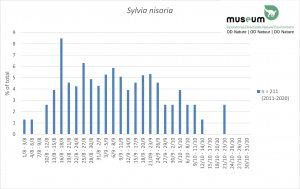
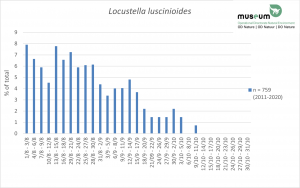
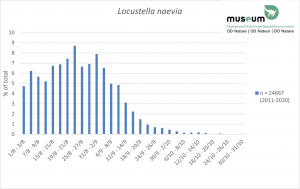
This first presentation of results compiles, in three-day periods, the ringing data collected throughout Belgium over the last 10 years. The results are expressed as a percentage of the total number of birds, from the species concerned, ringed during the reference period. The sample size (“n”) is presented next to each graph. These data are particularly robust considering the sample sizes in relation to the high density of their harvest – the land area of Belgium being ‘only’ 30,528 km².
The inter-annual variation in peak abundance will be presented in a second step.
Thanks to all the RBINS ringers who contributed to the collection of these data and to Paul Vandenbulcke who wrote papageno, the software for encoding these data.