
Over the past four decades, different satellites have been circling Earth whilst collecting numerous data. However, technology evolved during this time, creating the need for a unified processing method. A newly developed algorithm and software now make it possible to consistently process all these data and obtain unified image series for parameters such as water reflectance and turbidity.
Since the launch of Landsat 5 in 1984 the earth’s landmass and coastal zones have been imaged every 16 days. Landsat 5 provided regular imagery for over 25 years and was disabled fully in 2013. Its mission is being continued by Landsat 7 (launched in 1999) and Landsat 8 (2013). The Landsat missions are complemented by two Sentinel-2 missions, launched in 2015 (S2A) and 2017 (S2B) which image the earth every 5 days. The data from the Landsat missions has been open access since 2008, and those of Sentinel-2 since their launch. Combining the data streams allows the study of long time series, but due to differences in sensor design and image formats of these satellites, it was difficult to align these data over time. More precisely, an atmospheric correction algorithm and processing software for the automated and consistent processing of these images was needed.
Unified processing
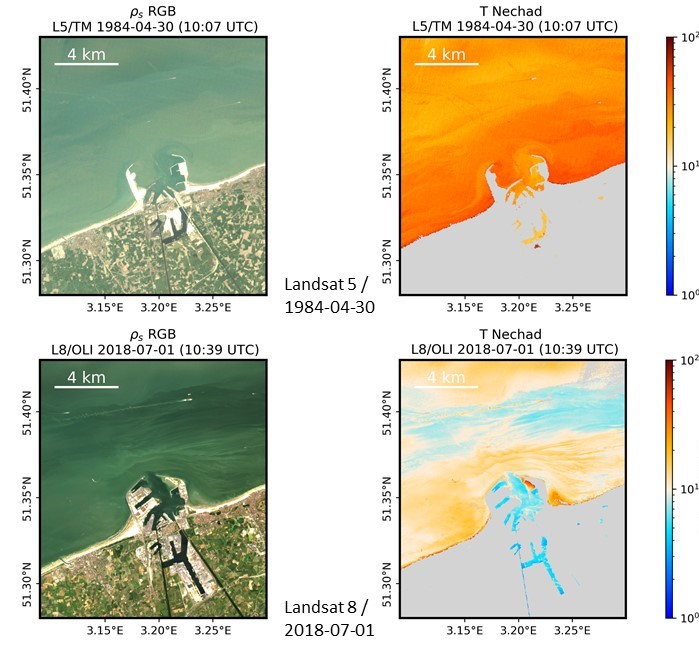
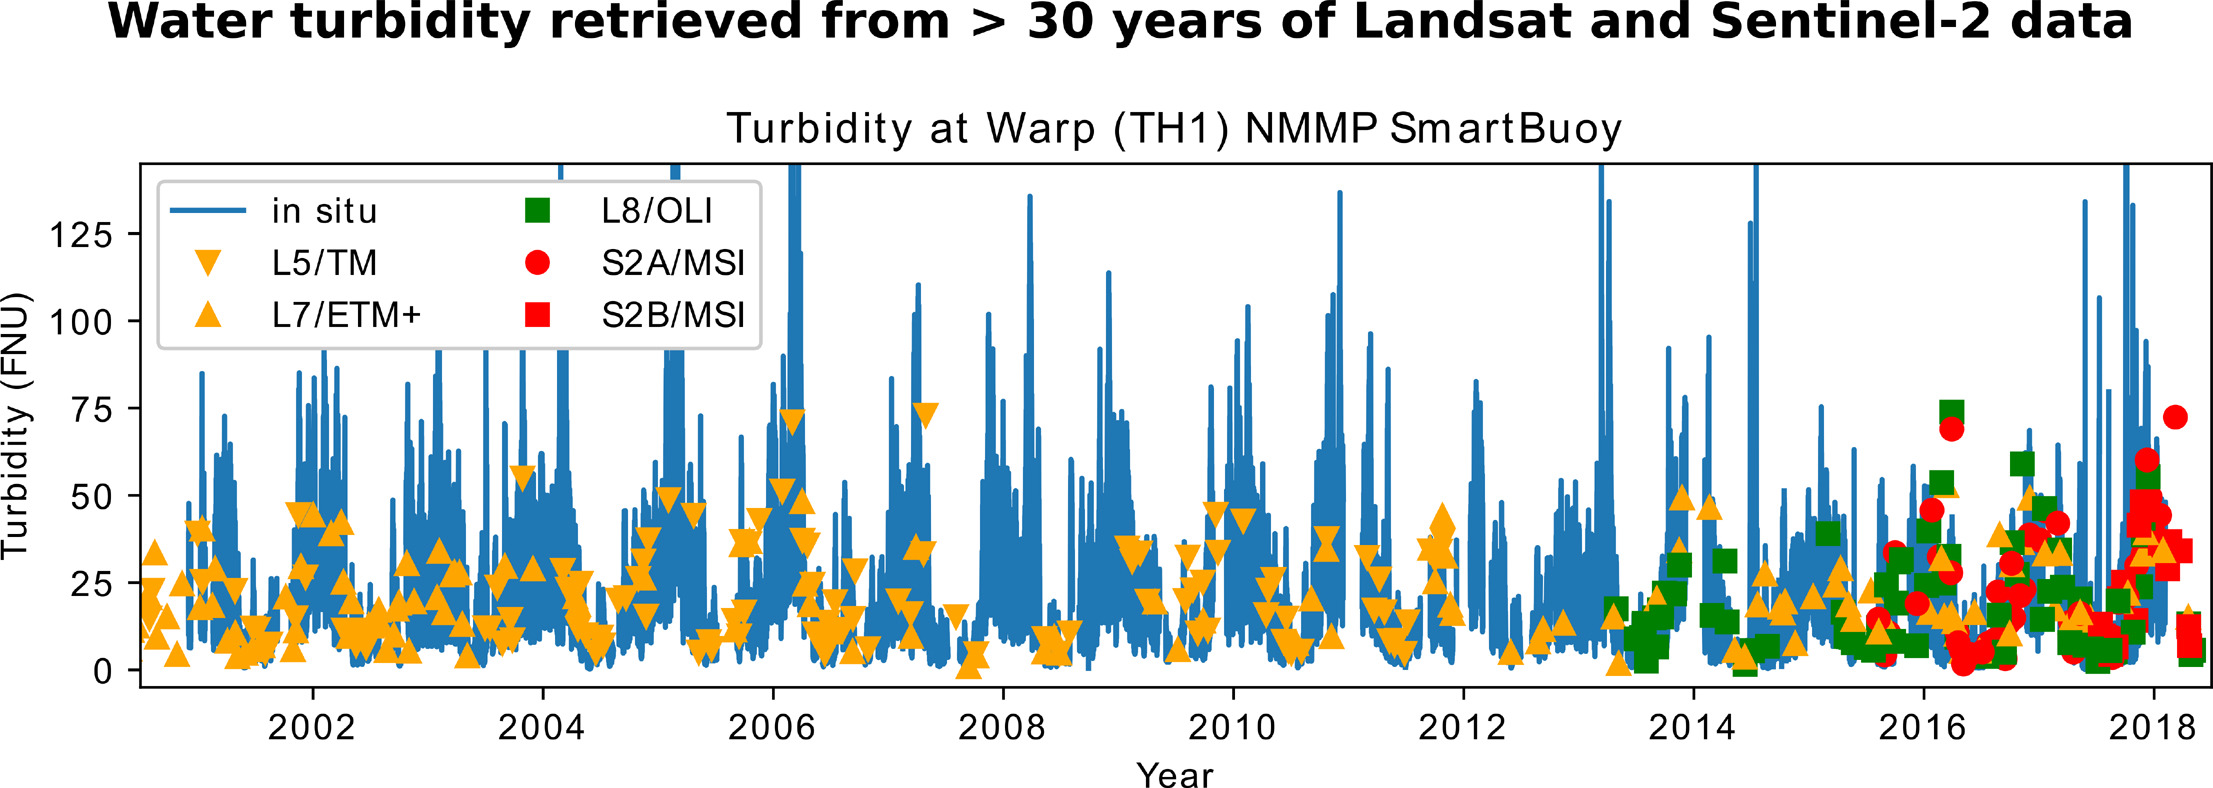
In a recent publication in the journal ‘Remote Sensing of Environment’, Quinten Vanhellemont of the Remote Sensing team (REMSEM) of our institute, describes a method for unified processing of these data in order to retrieve water reflectance and derived parameters, such as water turbidity. These products have been validated with a long time series of in situ measurements from around the globe (Figure 1). This method has been the default in the ACOLITE software since April 2018 that can process imagery from Sentinel-2A/B and Landsat 5/7/8. ACOLITE was also developed by Quinten at the Royal Belgian Institute of Natural Sciences.
Images of long time series
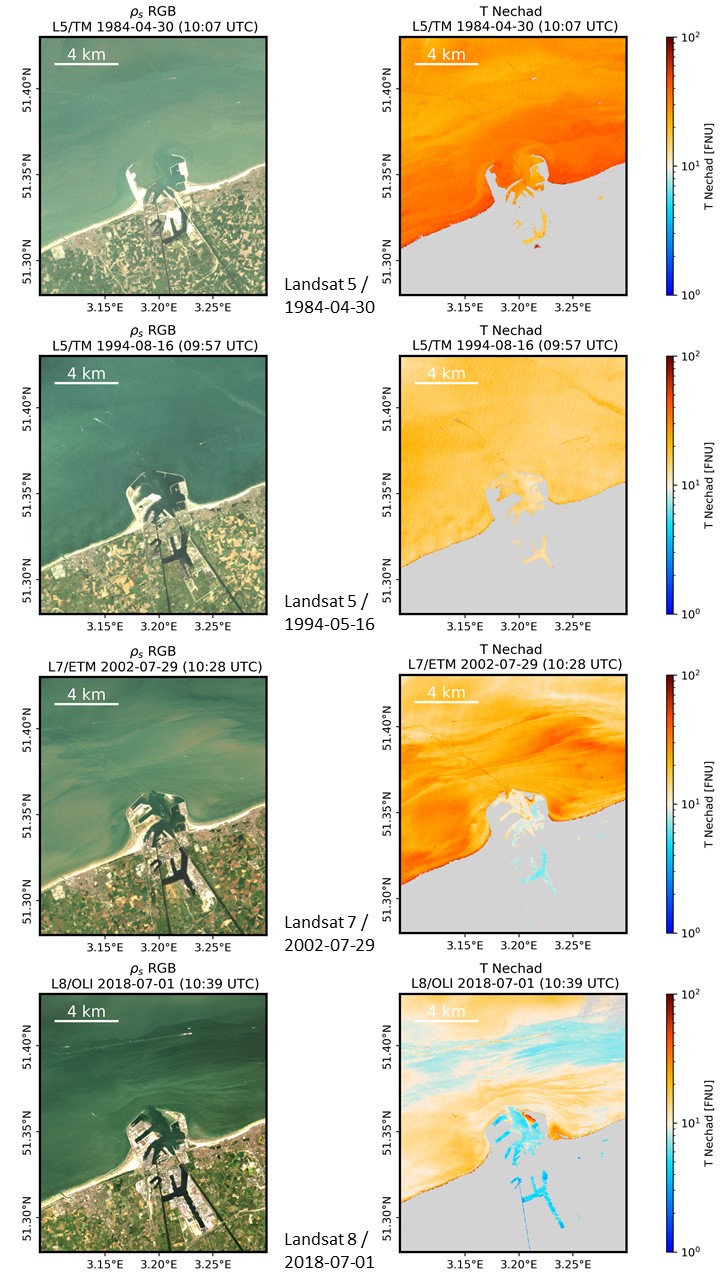
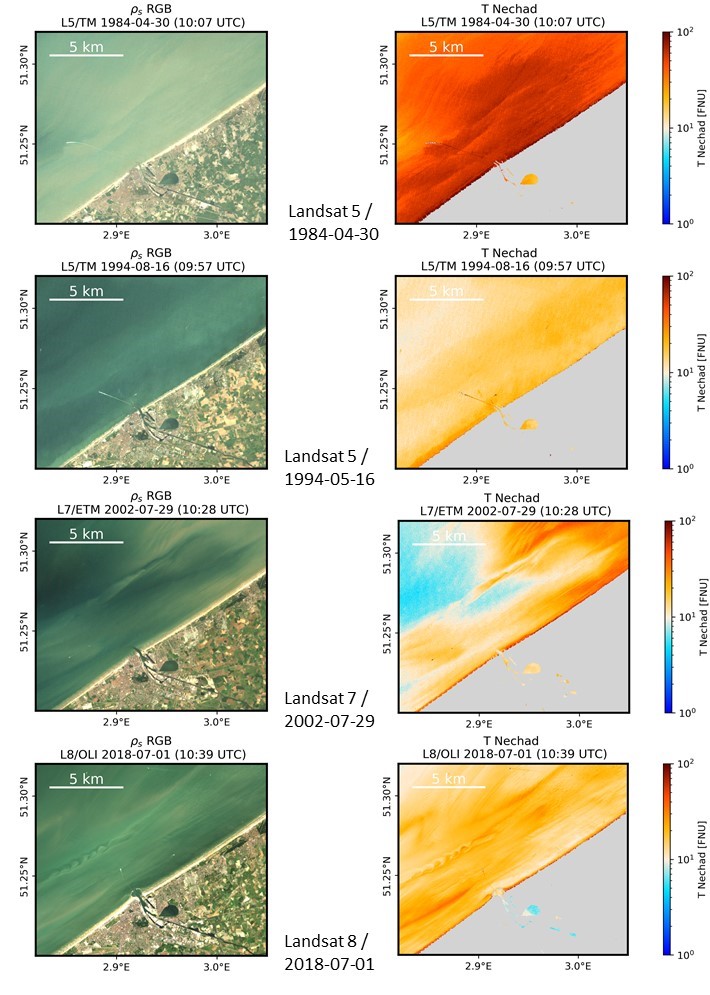
The unified processing of data collected by the different satellites provides standardized, easily interpretable (and also beautiful) data series and images series. In the Belgian coastal zone, we can for example observe the impact of the extension of the ports of Zeebrugge and Oostende on the sedimentation on both sides of the port walls. The image series in Figure 2 show an accumulation of sand on the beaches to the east and west of the extended ports. Water turbidity is also retrieved and is in the Belgian coastal zone mainly dominated by resuspension of bottom material in superimposed cycles: an annual cycle of winter-high, summer-low turbidity and cycles of ebb-flood and neap-spring tidal resuspension.
Vanhellemont, Quinten. “Adaptation of the dark spectrum fitting atmospheric correction for aquatic applications of the Landsat and Sentinel-2 archives.” Remote Sensing of Environment 225 (2019): 175-192. https://doi.org/10.1016/j.rse.2019.03.010
ACOLITE processor https://odnature.naturalsciences.be/remsem/software-and-data/acolite
ACOLITE forum https://odnature.naturalsciences.be/remsem/acolite-forum/
ACOLITE source code https://github.com/acolite/acolite